Proven Applications of Applied Intelligence
Illustrative AI enablement patterns for small and mid-sized businesses—across finance, operations, product, marketing, customer teams, and leadership. Each story shows how bounded pilots turn scattered work into workflows your staff can run and own.
About the headline metrics: figures in the cards below are illustrative composites for storytelling—they represent directional patterns seen across similar engagements, not audited results for a single named client. Use the info icon beside each figure for methodology and source type.
Finance & regulated ops
Automated Compliance & Reporting
Implemented a secure, air-gapped RAG (Retrieval-Augmented Generation) system to analyze thousands of regulatory documents, reducing compliance report generation time from weeks to hours while maintaining strict data privacy—without sending regulated content to public model APIs.
85%
How to read this figureTime saved (illustrative)
85%
How to read this figureHow to read this figure
Illustrative composite for documentation-heavy compliance workflows after introducing retrieval-style automation in an air-gapped pattern. Not a guarantee for any client; actual savings depend on process volume, data quality, retrieval accuracy, and change management.
0
How to read this figureData breaches (design goal)
0
How to read this figureHow to read this figure
Illustrative design posture for architectures that keep regulated content off public model APIs, enforce strict boundaries, and log access. Zero is an aspiration for the reference pattern—not a claim about any single historical deployment or breach record.

Operations & inventory
Predictive Inventory Orchestration
Architected a predictive model that integrates with legacy ERP systems. The solution anticipates supply disruptions and automatically re-routes inventory—reducing stock-outs for distributors and light manufacturers without a full platform rip-and-replace.
3×
How to read this figureFaster adaptation (illustrative)
3×
How to read this figureHow to read this figure
Illustrative improvement band for how quickly replanning cycles can respond when disruption signals are centralized versus manual coordination. Based on representative supply-chain narratives, not a measured benchmark from one client engagement.
−22%
How to read this figureOverhead reduction (illustrative)
−22%
How to read this figureHow to read this figure
Illustrative overhead reduction band when automation trims exception handling and manual reconciliation in comparable supply programs. Not audited financial impact; depends on baseline cost structure and scope of automation.

Software & product teams
LLM-Assisted Developer Productivity
Enabled product and engineering teams with secure, custom AI coding assistants tailored to their codebase—plus automated review pipelines that enforce quality and security standards without outsourcing delivery to a black-box vendor.
+40%
How to read this figureSprint velocity (illustrative)
+40%
How to read this figureHow to read this figure
Illustrative engineering throughput lift when secure assistants and review automation shorten repeat tasks. Depends on stack, governance overhead, measurement definition (e.g., story points vs. cycle time), and team baseline—not a universal promise.
98%
How to read this figureAdoption (illustrative)
98%
How to read this figureHow to read this figure
Illustrative adoption signal when rollout includes champions, training, and IDE-integrated workflows. Typically defined as active weekly use within a pilot cohort in comparable programs—not a headcount-weighted claim across an entire division unless separately measured.

Customer relationship
Customer Support Knowledge Assistant
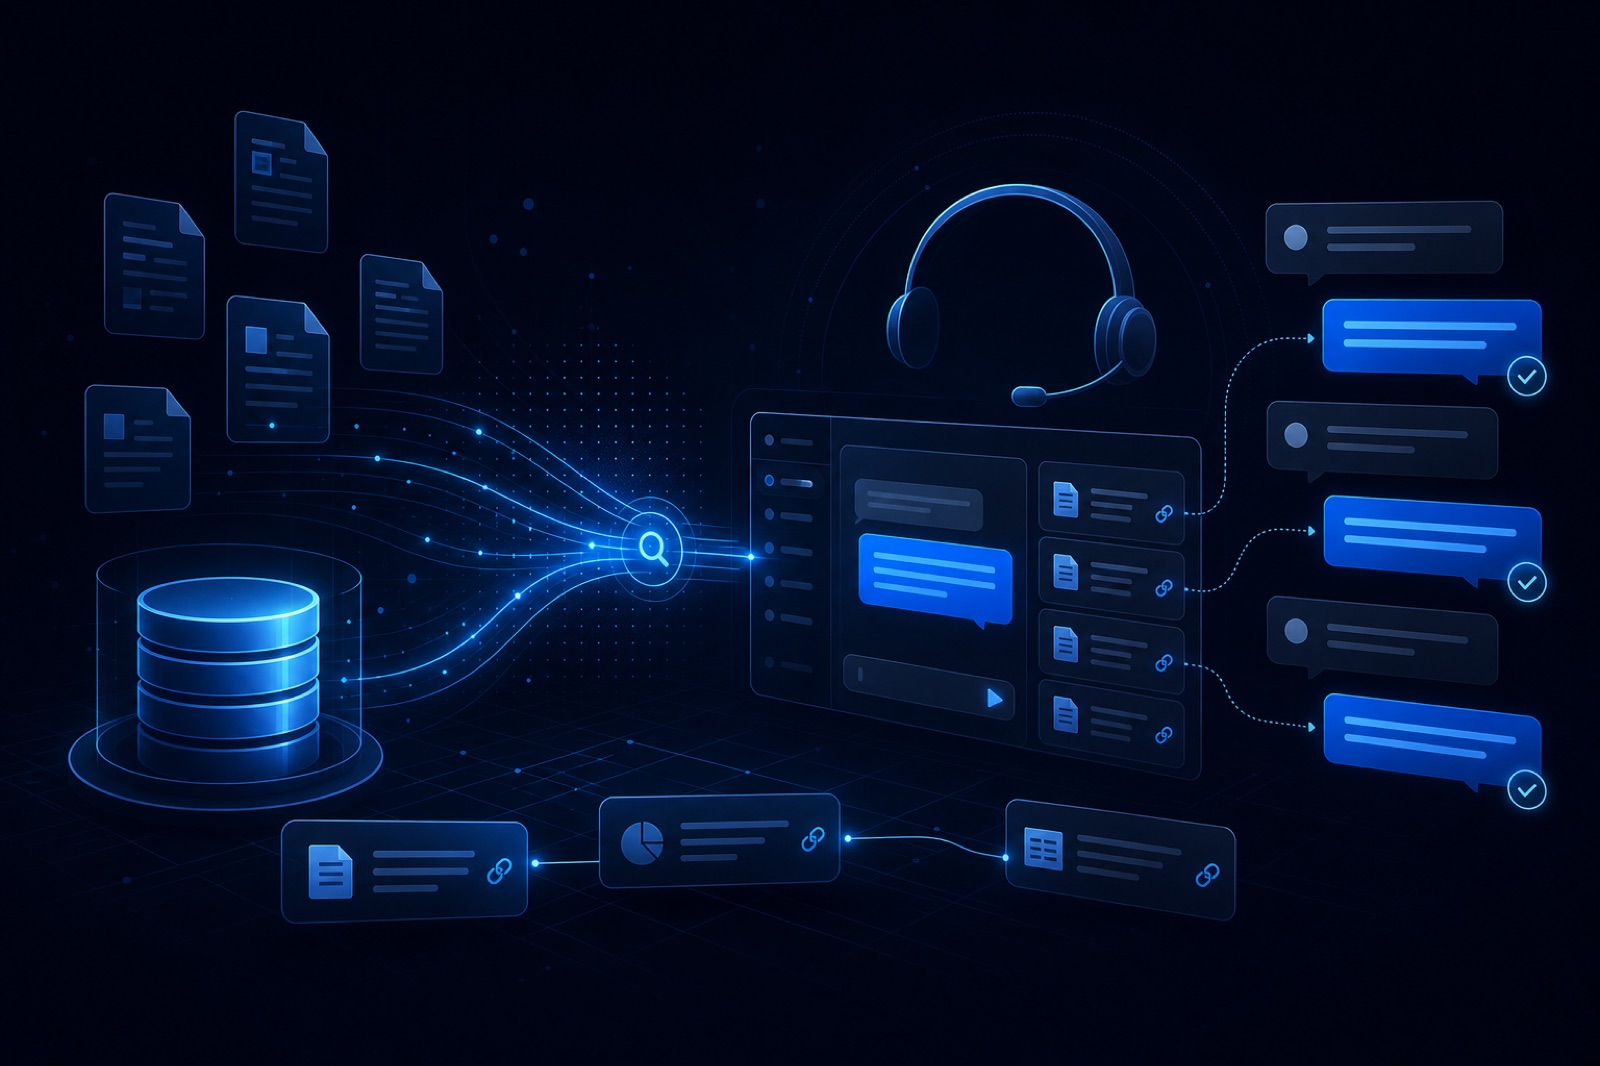
Connected helpdesk tickets, product docs, and policy snippets into a retrieval-backed assistant that drafts replies and cites sources—so frontline agents resolve repeat questions faster while humans stay accountable for every customer-facing message.
−35%
How to read this figureHandle time (illustrative)
−35%
How to read this figureHow to read this figure
Illustrative reduction band when agents use cited drafts for tier-1 and tier-2 repeat issues versus searching wikis and Slack threads ad hoc. Depends on knowledge-base quality, escalation rules, and channel mix—not a universal SLA improvement.
92%
How to read this figureFirst-contact resolution (illustrative)
92%
How to read this figureHow to read this figure
Illustrative first-contact resolution lift when answers are grounded in approved articles and macros. Measured within pilot queues that define resolution at first agent reply; excludes complex escalations unless your ops definition says otherwise.
Marketing
Marketing Content Ops with Human-in-the-Loop
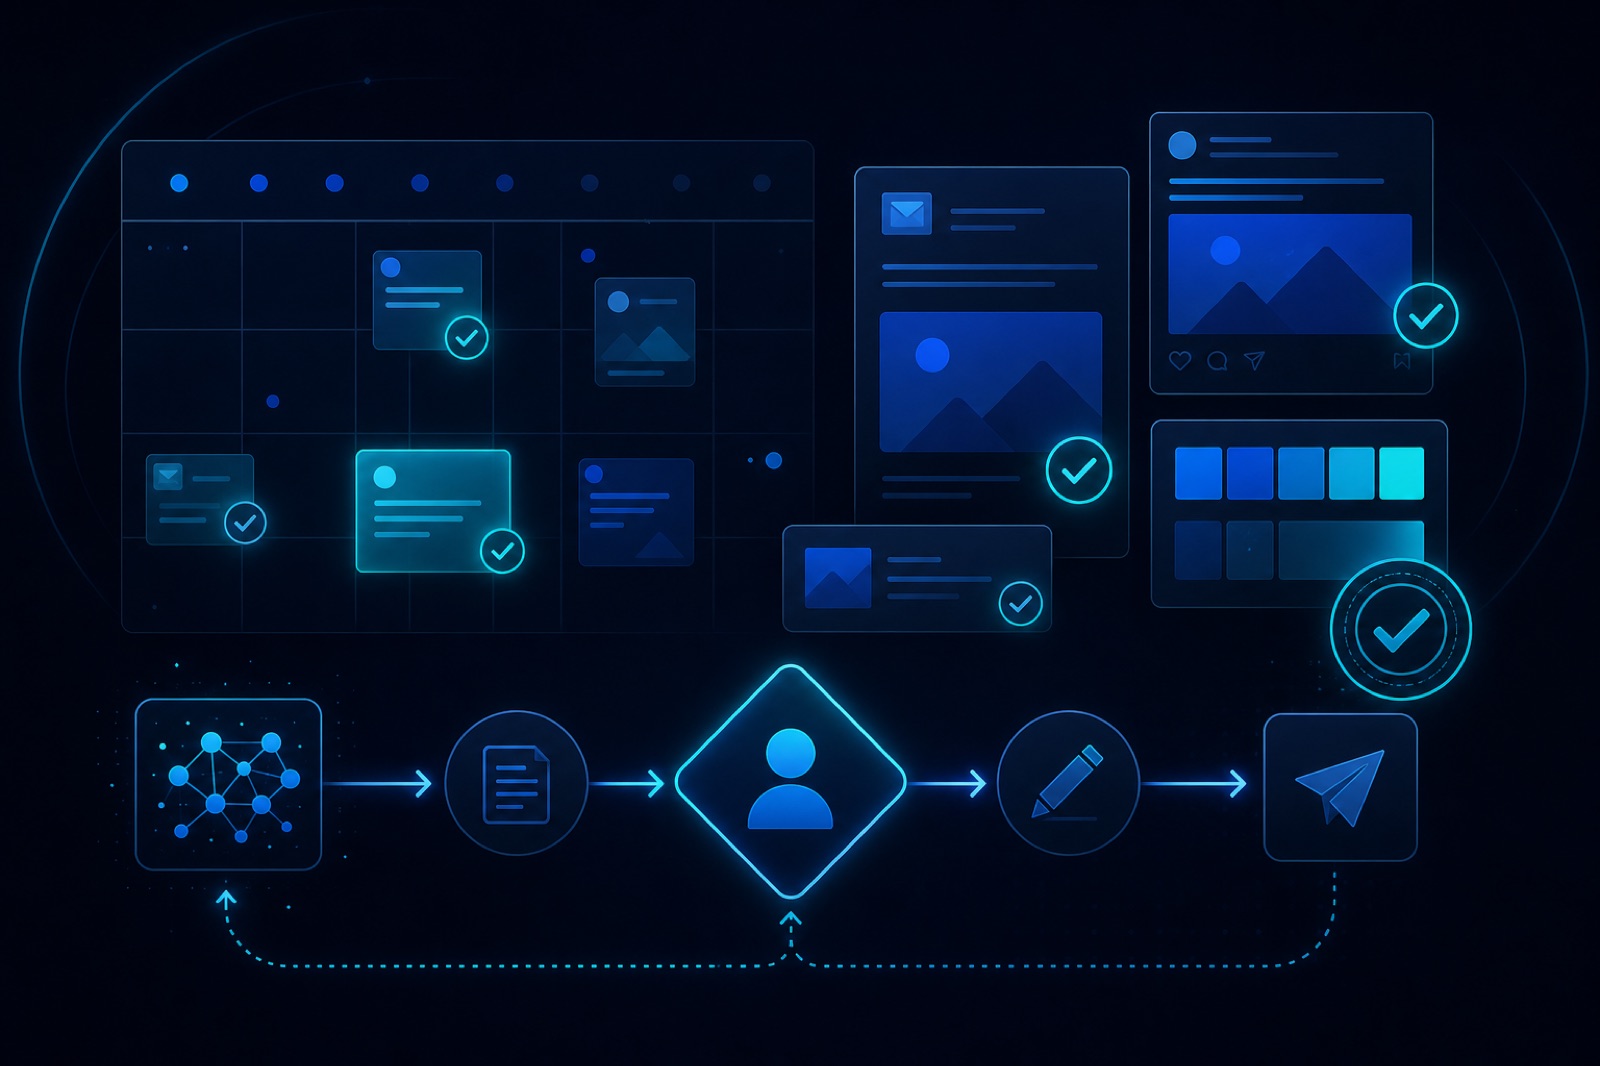
Stood up a bounded content pipeline: AI drafts campaign copy, social posts, and nurture emails from brand guidelines, while marketers approve, edit, and schedule every asset—keeping voice consistent without losing editorial control.
2×
How to read this figurePublish cadence (illustrative)
2×
How to read this figureHow to read this figure
Illustrative throughput band when draft generation and variant testing shrink cycle time for recurring campaigns. Assumes existing brand templates and a defined approval path—not greenfield positioning from zero assets.
100%
How to read this figureHuman approval (design goal)
100%
How to read this figureHow to read this figure
Illustrative governance posture: no customer-facing copy ships without explicit marketer sign-off. Represents the reference workflow pattern, not a certification of every historical campaign in a given organization.
Decision making
Leadership Decision Briefs from Scattered Reports
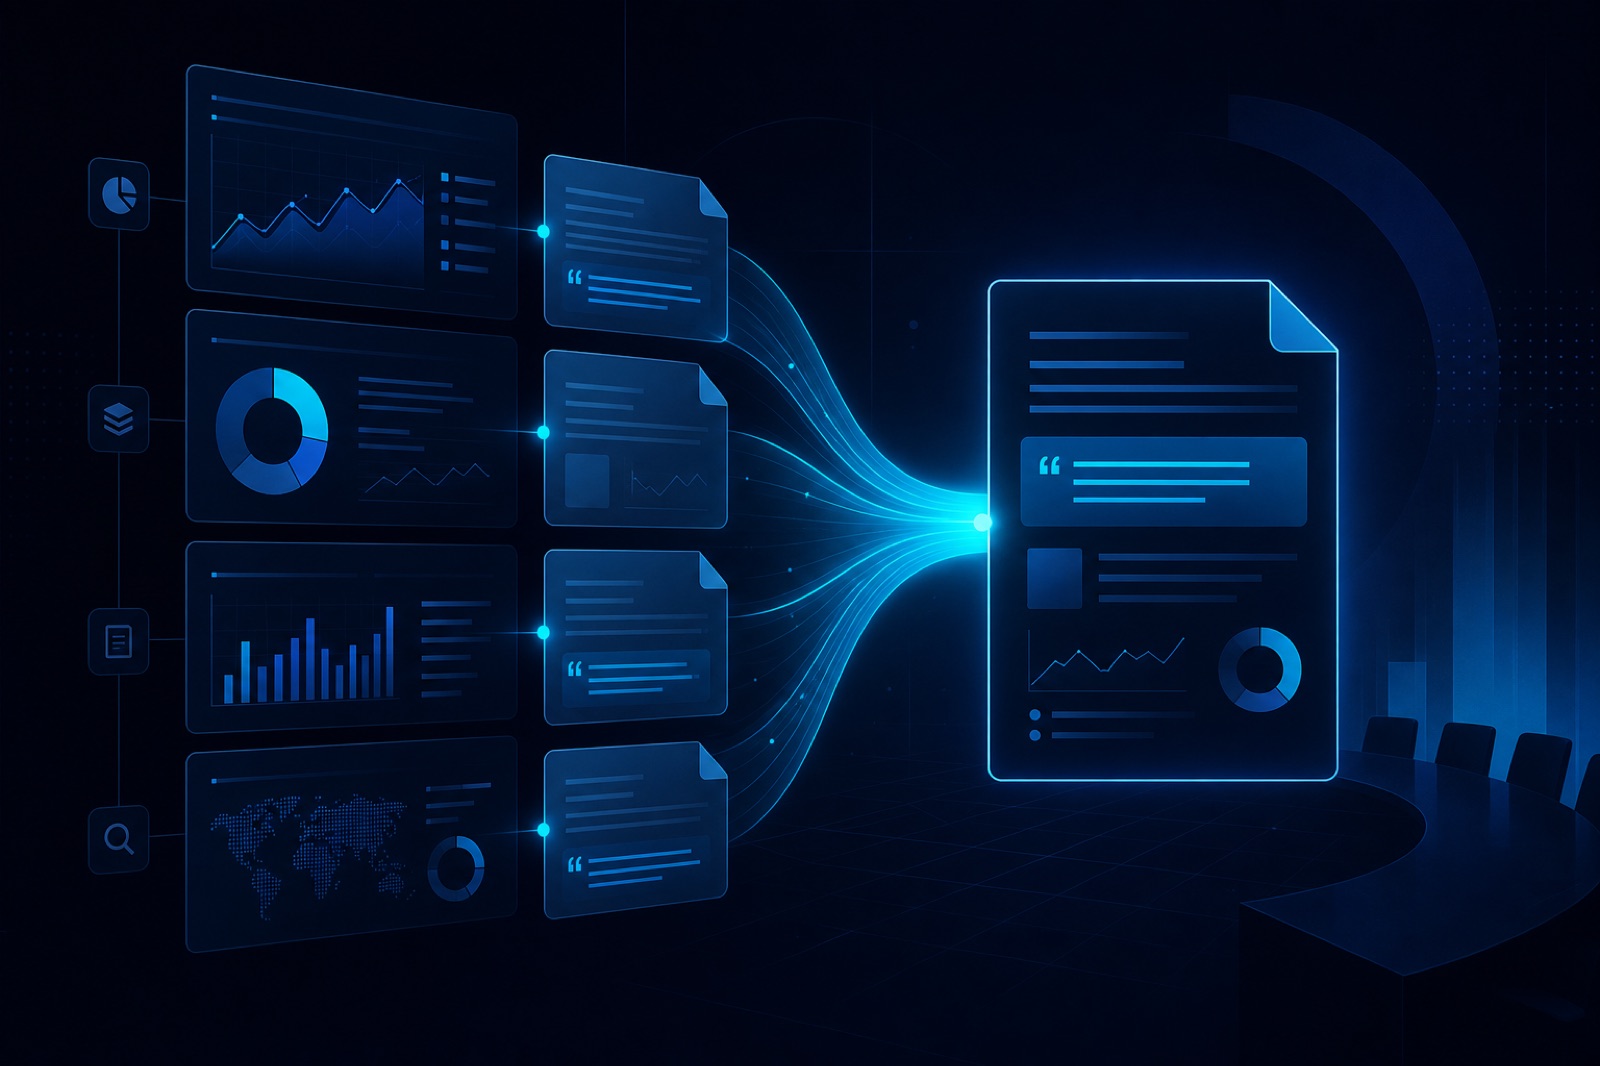
Aggregated board packs, department updates, and operational dashboards into weekly decision briefs with cited excerpts—so owners and leadership review trade-offs with shared context instead of reconciling conflicting slide decks.
−60%
How to read this figurePrep time (illustrative)
−60%
How to read this figureHow to read this figure
Illustrative reduction in leadership prep hours when briefing automation summarizes recurring inputs with source links. Depends on how fragmented reporting was at baseline and which systems are in scope for the pilot.
4
How to read this figureSources unified (illustrative)
4
How to read this figureHow to read this figure
Illustrative count of recurring input channels (e.g., finance, sales, ops, product) folded into one brief template in comparable programs. Not a promise to integrate every legacy system in a first phase.
Innovation
Product Feedback → Opportunity Themes
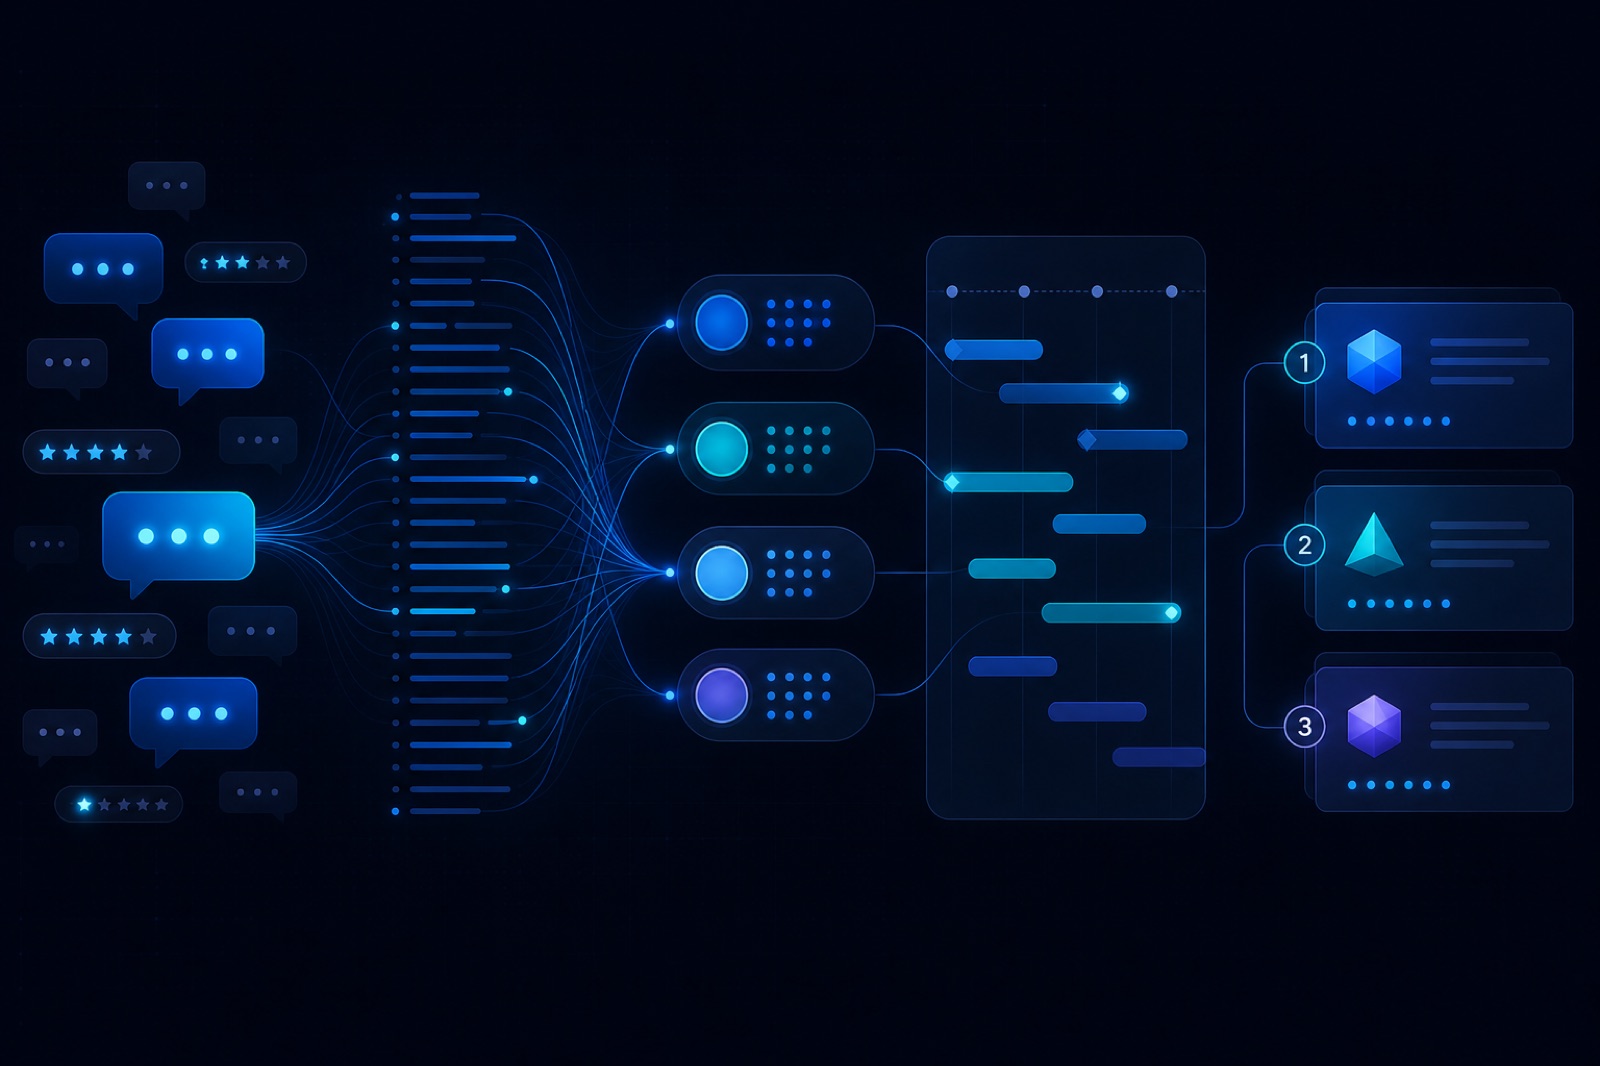
Clustered support transcripts, NPS verbatims, and sales notes into ranked opportunity themes with exemplar quotes—giving product leaders a repeatable voice-of-customer view without another manual tagging project.
−50%
How to read this figureSynthesis time (illustrative)
−50%
How to read this figureHow to read this figure
Illustrative time saved when theming runs on a scheduled pipeline versus quarterly manual coding of spreadsheets. Quality still depends on intake channels, PII handling, and how themes are validated with customers.
+3
How to read this figurePilot ideas per quarter (illustrative)
+3
How to read this figureHow to read this figure
Illustrative uptick in experiment proposals when ranked themes surface evidence leaders already trust. Counts funded pilots or time-boxed tests—not revenue outcomes attributed to AI clustering alone.